Main menu

Impact & Data

Global Malaria Dashboard

Data, trends and insights to guide the fight against malaria
Imagem
RBM priorities banner

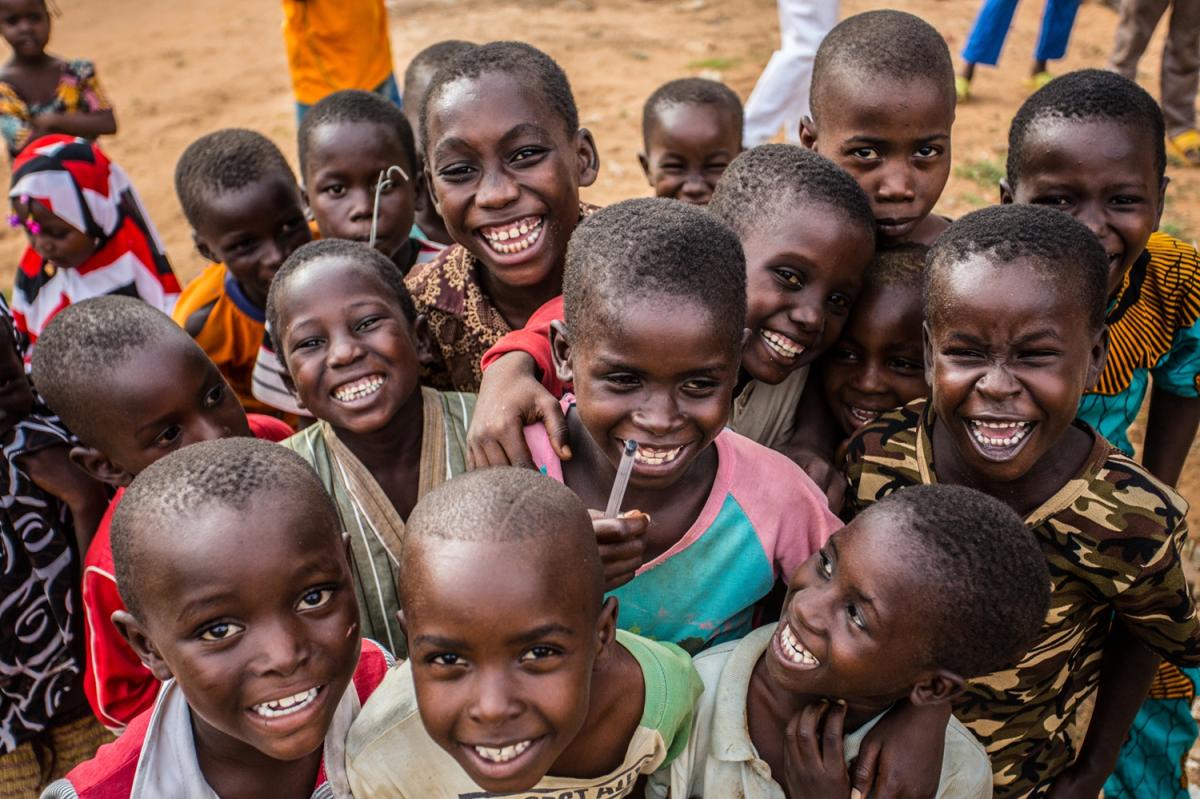
Every malaria death follows the exact same pattern: a child, a pregnant mother, a family left without the protective shield of our proven tools.

This is not a mystery disease. We have the science, the tools, and the track record. But having the tools is not enough: they require systematic use to build a barrier. And today, our front-line defences are facing their greatest threat: rapidly evolving biological resistance and shrinking budgets.

The Global Malaria Dashboard, hosted by UNOPS, brings together the data to track this fight.

Malaria at a Glance

80 countries and territories

Nearly half of the world’s population lives in areas at risk of malaria transmission.

282 million cases, 610K deaths

In 2024, malaria caused an estimated 282 million clinical episodes and 610K deaths.

94% of deaths in Africa

An estimated 94% of deaths in 2024 were in the WHO African Region.

According to the 2025 World Malaria Report

Malaria hits pregnant women and young children hardest, but our tools are working.

13M

Pregnancies infected with malaria (36%) in 33 African countries

75%

Of malaria deaths in Africa were children under 5

170M+

Malaria cases averted globally in 2024

1M+

Malaria deaths averted globally in 2024

But malaria…

No child should die from malaria. We have the tools to prevent, treat, and eliminate malaria. Yet every day, systematic gaps and rising biological resistance cost more young lives.
1

Can be prevented

Nets, seasonal medicines, and infant vaccines only save young lives when communities systematically complete every protective protocol.
2

Can be treated

Speed is survival for a child. A rapid test and a $2 cure can stop the parasite in days, but only if we act before uncomplicated infections turn fatal.
3

Can be eliminated

A safe future is possible. 48 countries have proven we can break transmission entirely, ensuring no more children are buried because of a mosquito bite.
4

But progress is stalling

Stagnation kills. As resistance grows and cases rise, children under five pay the ultimate price.

Explore the dashboards

The Global Malaria Dashboard brings together the latest malaria data in one place, organised in seven areas:

  • Malaria at a Glance: Key global figures on the malaria burden and the impact of our tools.
  • Surveillance & Intelligence: Surveillance projects, resistance and social and behaviour change data.
  • Supply & Commodities: Availability and supply of malaria commodities.
  • Country Support: Support to national malaria programmes.
  • Funding, Gaps & Donors: Programmatic and financial gaps, and who is funding the response.
  • Campaigns & CHW: Malaria campaigns and community health workers.
  • Research & Innovation: New tools and research to end malaria.

Open the Global Malaria Dashboard

Implementing Partners Surveillance

A global overview of projects with a focus on malaria surveillance, created by the RBM SMERG SP&DQ Committee to improve global awareness of surveillance interventions across stakeholders. The Committee aims to improve the visibility of surveillance and data quality improvement initiatives, streamline global coordination of surveillance-related efforts, and establish a tracking mechanism for implementing partners’ initiatives and projects and NMCPs’ surveillance operations framework.

The projects are funded by 36 donors, and 43% of them are primarily focused on surveillance.

67 projects

Surveillance projects tracked, covering data quality, governance, case surveillance and data to action.

62 countries

Countries where implementing partners run malaria surveillance projects.

30 implementing partners

Organisations implementing surveillance projects, supported by 36 donors.

Visit the Global Malaria Dashboard

Explore the full, interactive dashboards: filter by country, region and theme, and dive into the data behind the global malaria response.
Go to dashboards.endmalaria.org